Mechatronics 2kHz and 25kHz Signal Detectors
UCSC - Mechatronics
Project Description
The aim of this project is to create two analog sensors each detecting a specific signal. The first sensor is a track wire detector that can sense the presence of a wire carrying 24-26kHz current when it is 2 inches away or further.The second analog sensor is the beacon detector which must sense a 2kHz IR signal from at least 6 feet away. The beacon detector must also filter out any off-frequency noise and only allow 2kHz signals to pass. Both sensors were part of an assignment for ECE 118 and are implemented in the autonomous robot discussed here.
The Beacon Detector
The purpose of this circuit is to detect signal from at least 6 feet away and convert the signal to a digital output shown by an LED. This circuit was prototyped on a breadboard using MCP6004 quad Op-Amp chips, an LM339 comparator chip, and many resistors and capacitors. After prototyping, the circuit was soldered onto a perfboard.
Components list:
- MCP6004 Quad Op-Amp Chip
- LM339 Comparator Chip
- Phototransistor
- LEDs
- Assorted resistors and capacitors
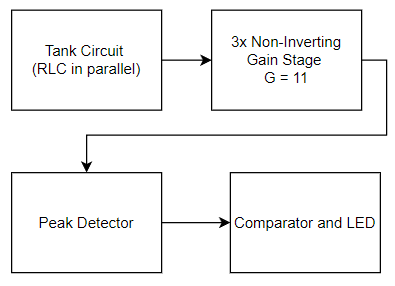
The analog circuit for the Beacon Detector uses these stages to detect a 2kHz IR signal at up to 10 feet away from the phototransistor.
Transresistive Op-Amp
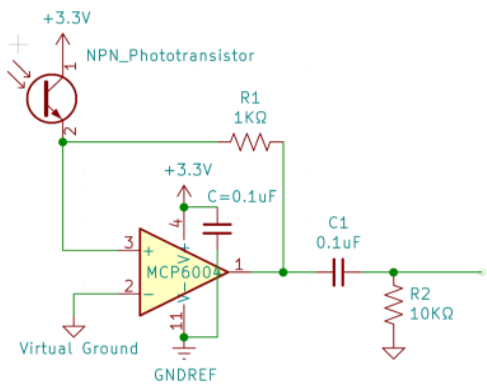
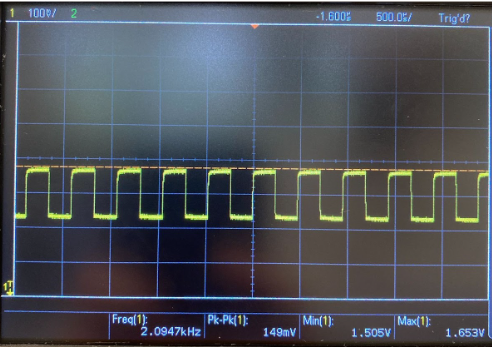
The transresistive Op-Amp takes is the first stage of the beacon detector circuit in which the 2kHz input from the phototransistor is turned into a linear square wave as below.
Non-Inverting Amplification
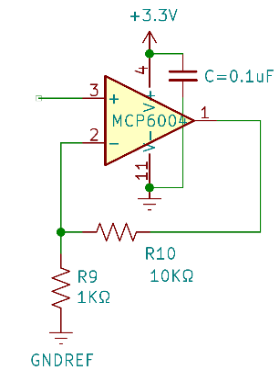
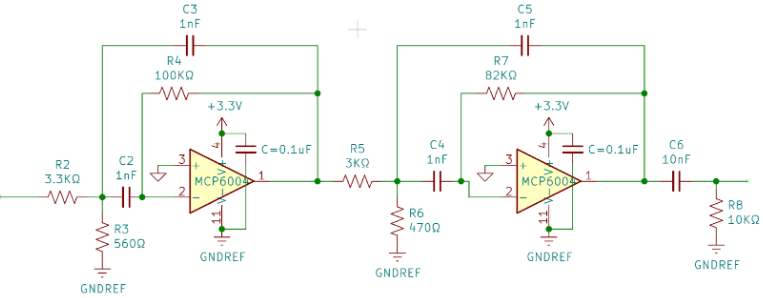
After this, the signal goes through 4 stages of non-inverting amplification, each amplifying by a factor of 11. The amplification is done by using an Op-Amp in the non-inverting amplifier configuration as shown in the image below:
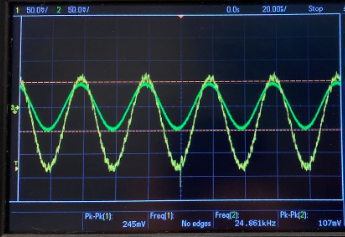
The image below shows a scope trace of a signal amplified by a factor of 2:
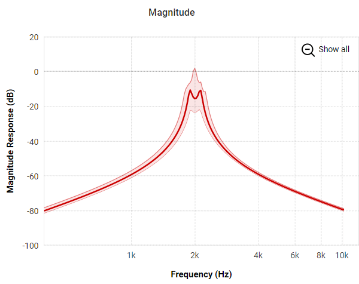
Bandpass Filter
Then, the signal is filtered to reject any signal that has a frequency other than 2kHz. The filter designed for this circuit is a 4th order Butterworth Bandpass filter. The center frequency is 2kHz with cutoff frequencies of 1.8kHz and 2.2kHz. The circuit for the filter is shown below as well as its simulated response:
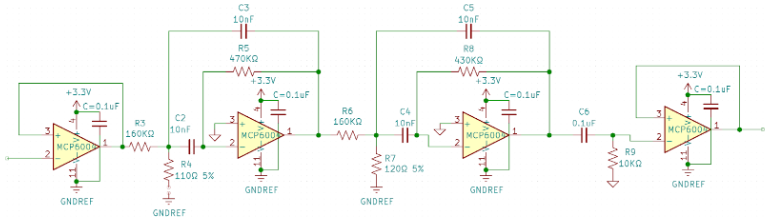
Note that the filter also uses virtual ground to avoid cutting off the lower part of the wave. This filter was tested with 1.5kHz and 2.5kHz IR noise and successfully attenuated them.
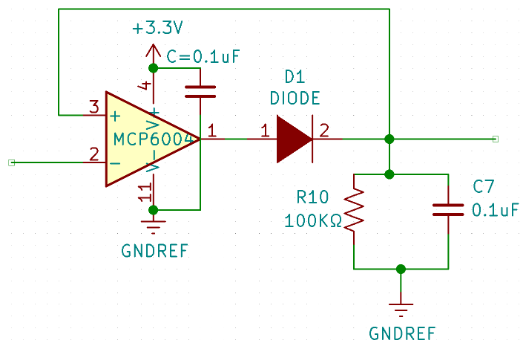
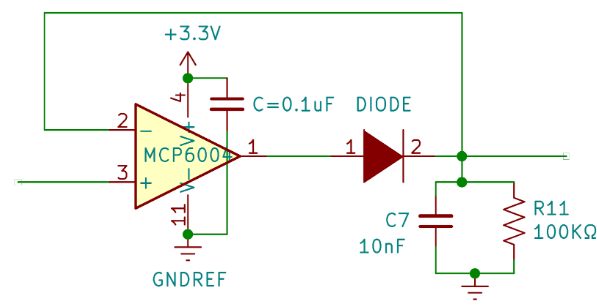
Peak Detector
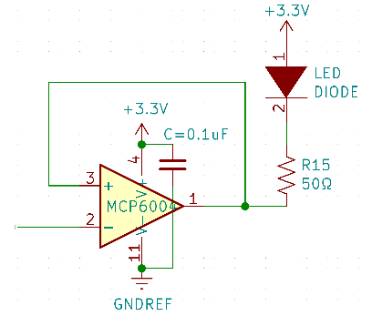
The next stage of this circuit is the peak detector, which is the first step in converting the signal from a sinusoidal wave to a digital HIGH or LOW. This stage uses a resistor and capacitor with an RC time constant of 10ms to detect the peaks of the wave and hold the signal at the peak. This is done by quickly charging a small capacitor and allowing it to slowly discharge with a large resistor in parallel. The circuit shown below uses a buffer Op-Amp and a diode to force the current into the capacitor:
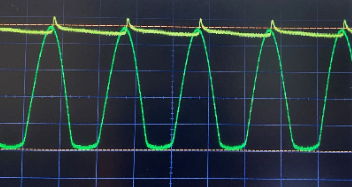
The trace below shows the peak detector following an input sinusoidal signal.
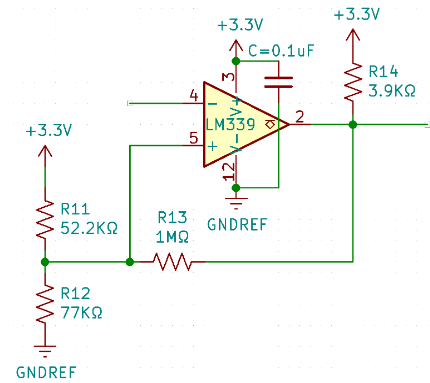
Comparator and LED Buffer
The final stages of this circuit are used to complete the analog to digital conversion. The peak detector’s output is routed to the comparator which acts as a Schmitt trigger. The comparator has two threshold bounds. If a signal exceeds the high thresholds, the comparator outputs a LOW 0 volts. If a signal is below the lower threshold, the comparator outputs HIGH 3.3V. Combining this with an LED in a pull-up configuration effectively inverts the comparator’s output and tells when a signal is detected. The comparator configuration as well as the LED Buffer are shown below
Other Components
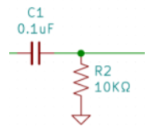
It is important to note that some AC coupling was added after each major stage to remove the DC component from AC signals. This was done by implementing a high pass filter with a low cutoff frequency of ~160Hz.
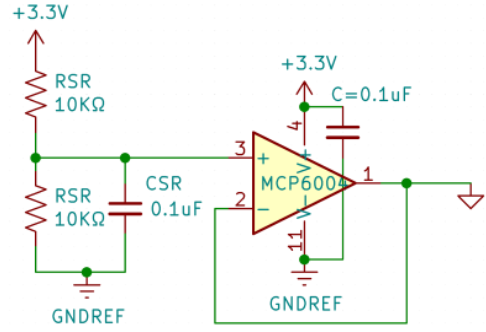
Another vital component is the split rail buffer. This provides the necessary 1.65V to offset the AC signals and prevent losing the lower half of the sinusoidal waves.
The Track Wire Detector
The Track Wire Detector uses similar circuit components to detect current running through a wire at 24-26kHz. This was also first prototyped on a breadboard then soldered onto a perfboard using the same components as the Beacon Detector.
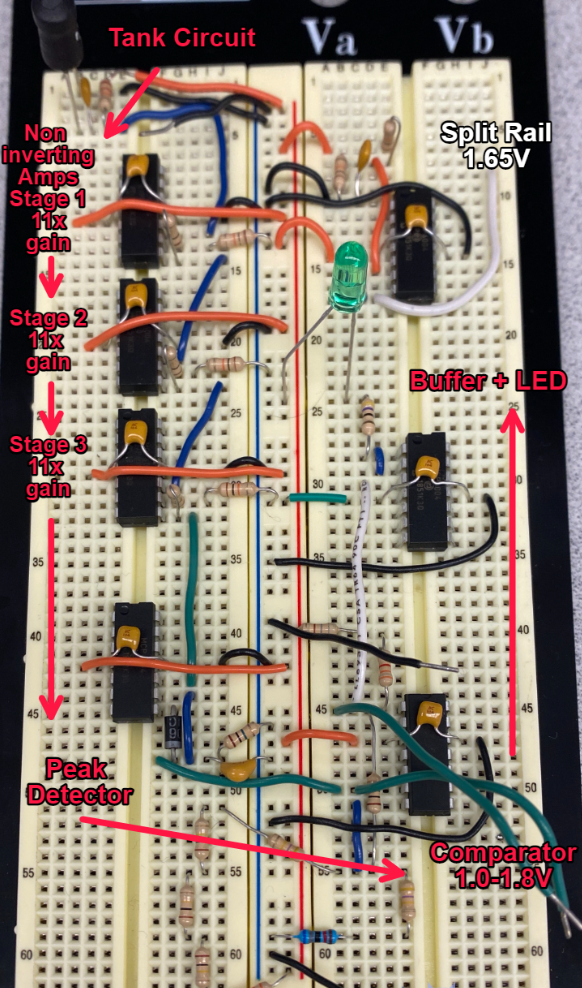
The analog circuit for the Track Wire Detector uses these stages to detect a 24-26kHz signal that is 2” away from the input stage. The circuit is very similar to the Beacon Detector discussed above with a few notable differences.
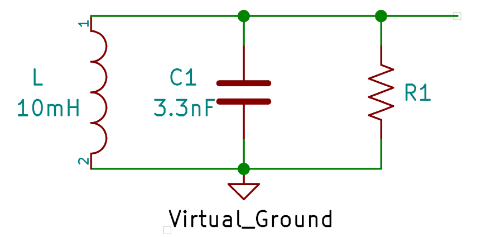
Tank Circuit
The first stage of the detector is the tank circuit. It uses a 10mH inductor to pick up the signals from the wires and charge/discharge a 3.3nF capacitor. The result is a sine wave that oscillates at the frequency of the wire.
Non-Inverting Amplification
This circuit required 3 cascaded stages of 11 gain to detect the signal at a 2 inch distance.
Peak Detector
The peak detector remains in the same configuration however, since the input signal has a different frequency averaging at 25kHz, the time constant must be modified to track this new signal. The period of a 25kHz signal is 0.00004s. The time constant for the peak detector should be at least 5 times the period. However, through experimentation, it was found that a time constant of 0.001s gives the best result. While this does delay the system’s response, it allows for the best peak tracking.
Noise Filtering
Due to noise from DC motors and other sources, a filter was implemented into the circuit during the final project. The filter chosen is a Butterworth Bandpass with centered at 25kHz. The circuit is displayed below:
Comparator
This circuit uses the LM399 to make a comparator with 1.0V and 1.8V thresholds. The circuit is similar to the comparator above with the following differences:
R11 = 800k ohm
R12 = 533k ohm